The video shows a montage of lifestyle and product shots, including beauty, home care, food and personal care images.
Detailed description
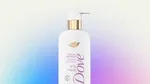
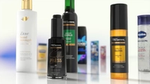
The video opens with a softly lit shot of a woman in a pale pink top holding a small tube of Vaseline Gluta-Hya serum near her face. The background is bright white, and the camera focuses on her face and upper body.
This transitions into a close-up of a pink tube of Vaseline Gluta-Hya Dewy Radiance serum burst lotion centred against a white background, surrounded by glossy pink gel droplets. The text on the tube reads: “Glutaglow hyaluron niacinamide 70x more powerful than vitamin C”.
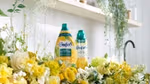
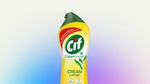
The next frame shows a close-up of a green and white spray bottle, with light reflecting through it. A green Cif logo appears on the bottle as it revolves. The next shot shows two Cif Infinite Clean bottles centred against a plain white background, one is a reload bottle. The bottles are upright and sharply in focus. The video shows the spray trigger being removed from the bottle on the left and being placed onto the refill bottle on the right, demonstrating the reusability of the spray trigger device. The final image in this sequence shows the trigger spray being activated, filling the screen with the product mist.
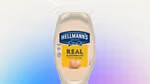
The scene cuts to a refrigerator interior shot. A bottle of Hellmann’s Spicy Mayonnaise stands upright in the centre, surrounded by fresh ingredients such as tomatoes and red peppers.
Next is a close-up of crispy fried chicken. The texture is highly detailed and fills the frame. The camera zooms out to show the fried chicken being dropped in a white bowl with a blue rim. The bowl already contains several layers including melted cheese and lettuce, and the chicken falls on top.
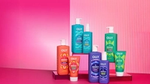
Following this, a slightly out-of-focus shot shows three personal care products arranged on a reflective silver tray in front of a person. The three products come into view, revealing Dove Whole Body Deo in a cream, spray and stick format.
The final shot features a woman, wearing a black textured crop top and large hoop earrings. She appears happy and energetic, tilting her head back and moving her arm upward while spraying a can of Dove Whole Body Deo. The blurred background shows other people, suggesting a busy outdoor setting.
No audio and no captions available
Q1 2026 Overview
Strong volume growth; full year outlook reconfirmed
3.8% underlying sales growth
2.9% underlying volume growth
5.0% underlying sales growthdelivered by our Power Brands
4.0% underlying volume growthdelivered by our Power Brands
Underlying sales growth (USG)
Charts require JavaScript to be enabled.
Underlying volume growth (UVG)
Charts require JavaScript to be enabled.
Underlying price growth (UPG)
Charts require JavaScript to be enabled.
First quarter 2026 highlights:
Volume-led growth - underlying sales growth (USG) of 3.8%, with volume growth of 2.9%, and price of 0.9%
Broad-based growth across categories with Power Brands leading performance: 5.0% USG and 4.0% volume growth
Emerging market momentum led by strong growth in India and good recovery in Latin America
Turnover of €12.6 billion - down 3.3% as positive USG and net acquisitions and disposals were offset by currencies
Unilever Foods combination with McCormick announced - unlocking value by shaping Unilever into a leading pureplay HPC company and creating a global flavour powerhouse in Foods
Quarterly dividend up 3.0% vs Q1 2025
€1.5 billion share buyback commences today - expected to complete on or before 6 July 2026
Our Business Groups
Our brands operate in four Business Groups, each fully responsible and accountable for its strategy, growth, and profit delivery globally.
Beauty & Wellbeing
Consists of Hair Care, Skin Care, Prestige Beauty and Health & Wellbeing (including the vitamins, minerals and supplements business).
In the 2025 financial year Beauty & Wellbeing had a combined turnover of €12.8 billion.
Geographical footprint – split by geographical area
Charts require JavaScript to be enabled.
Geographical footprint – Emerging versus Developed Markets
Charts require JavaScript to be enabled.
Geographical footprint - Top 5 countries
USA
India
China
Netherlands
United Kingdom
“We have started the year well with volume-led growth driven by our Power Brands and a positive performance across all Business Groups. There is broad-based momentum across our emerging markets business, with a strong performance in India, and a good recovery in Latin America following the decisive actions we have taken in that region.
We continue to move at speed to build a simpler, sharper Unilever with a structurally higher growth profile and a brand portfolio fit for the future. In March, we announced an agreement to combine Unilever’s Foods business with McCormick, unlocking value by shaping Unilever into a leading pureplay HPC company and creating a global flavour powerhouse in Foods.
Despite heightened macroeconomic uncertainty, the progress we are making to elevate our brands through Desire at Scale and improve operational execution means we remain confident of delivering on our guidance for the year ahead.”
Fernando Fernandez, Chief Executive Officer
FAQs
What is Unilever’s financial performance?
Unilever delivered underlying sales growth of 3.8% in Q1 2026, driven by strong volume growth of 2.9% and price growth of 0.9%. Growth was led by Power Brands which delivered 5% underlying sales growth with 4% volume and 1% price. Growth was broad-based across categories with strong performance from Home Care and emerging markets.
What is Unilever’s outlook for 2026?
Unilever expects full-year 2026 underlying sales growth at the bottom end of its 4–6% guidance range, with at least 2% volume growth and modest margin improvement versus 2025. The company remains confident in delivering this outlook despite macroeconomic uncertainty.
Does Unilever have a premium portfolio?
Yes, Unilever has an increasingly premium portfolio, with growth driven by premium innovations across brands such as Dove, Vaseline, Dirt is Good and Hellmann’s. Premium segments, digital channels and higher-value formats are contributing disproportionately to growth across North America and emerging markets.
How are Unilever’s Power Brands performing?
Unilever’s Power Brands, which represent around 78% of turnover, grew 5.0% in Q1 2026 with 4.0% volume growth, outperforming the overall business. Growth was driven by strong innovation, premiumisation and consistent investment behind brands such as Dove, Vaseline, Hourglass, Olly and Hellmann’s.
Is Unilever meeting its growth targets?
Unilever is on track to meet its growth targets, delivering 3.8% underlying sales growth in Q1 with strong volume momentum. While this is slightly below its 4–6% annual range, the company expects growth to build through the year and has reaffirmed full-year guidance.
What are Unilever’s biggest growth drivers?
In Q1 2026 Unilever’s growth was driven by Power Brands, emerging markets and premium innovation. Power Brands delivered 5% underlying sales growth with 4% volume and 1% price. Emerging markets delivered 5.7% growth with 4.2% volume, led by India, while categories such as Home Care and Personal Care benefited from improved execution and stronger competitiveness.
Which analysts cover Unilever and what is the current 2026 consensus view?
Unilever is covered by around 15 of global equity analysts. For Q1 2026, consensus expected underlying sales growth of 3.6%, with 1.8% volume and 1.8% price, compared to reported underlying sales growth of 3.8%, driven by 2.9% volume and 0.9% price.
For full-year 2026, consensus expects 4.0% underlying sales growth, 2.1% volume growth, 1.9% price, and an underlying operating margin of 20.1%, with EPS growth of 3.4%.
How do Unilever’s Power Brands contribute to earnings and shareholder returns?
Unilever’s Power Brands are its primary growth engine, representing around 78% of turnover and delivering faster growth than the rest of the portfolio. Their strong volume growth, premium positioning and scale drive higher margins, cash generation and ultimately support dividends and share buybacks for shareholders. In Q1 2026, Power Brands delivered 5% underlying sales growth with 4% volume and 1% price.